|
|
Your source of photonics CAD tools | |
|
| ||
HaroldA hetero-structure laser diode model |
    |
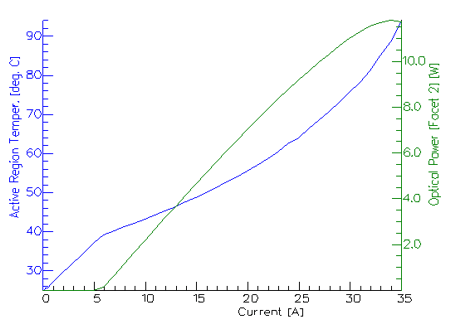
A high power Fabry-Perot laser diode modelSimulation in 1D and 2D with Harold softwareThis example uses a 1D Harold simulation to investigate the basic characteristics of a high power 808nm AlGaAs laser, and then uses 2D simulations to study the mechanisms of mirror heating. The simulated device was a high power, broad area (4000 um-wide) AlGaAs laser with graded-index separate confinement SQW structure. The left and right end facet were high-reflecting and low-reflecting respectively. 1D simulation - basic
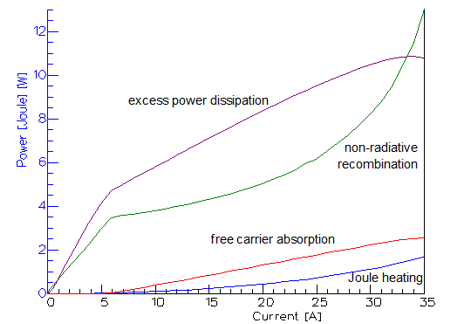
characteristics 1D simulation - basic characteristicsHarold’s 1D simulation mode provides a quick way of obtaining the basic characteristics of a laser device by assuming uniformity in the longitudinal direction. The device was first simulated in 1D self-heating (CW) mode to obtain the basic device characteristics. Some of these are shown in the figures below. The first shows the optical output power and corresponding active region temperature versus current. The second shows the various power dissipation mechanisms in the laser, where the excess power dissipation referred to is that needed to account for all remaining dissipation mechanisms so as to balance the input electrical power, IV. Physically, excess power dissipation arises mainly from spontaneous emission and scattered stimulated simulation.
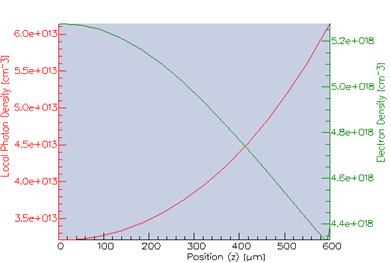
Such Harold simulations allow one to easily assess whether a laser design has the desired basic characteristics and to see how it could be improved. In this example, it can be seen that the two largest power dissipation mechanisms – and therefore the largest contributors to device heating – are excess power dissipation and free-carrier absorption. Reducing these would therefore lead to an improvement in the laser design. 2D simulation – hole burningHarold's 2D model allows one to do a more rigorous simulation a device by allowing for non-uniformity in the longitudinal direction. Owing to the high-low facet reflectivity arrangement of the example device being considered here, the photon density is non-uniform, leading to longitudinal spatial hole burning. The simulated results are shown below.
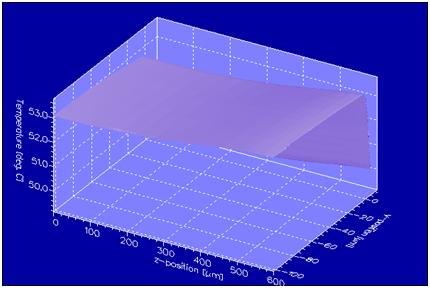
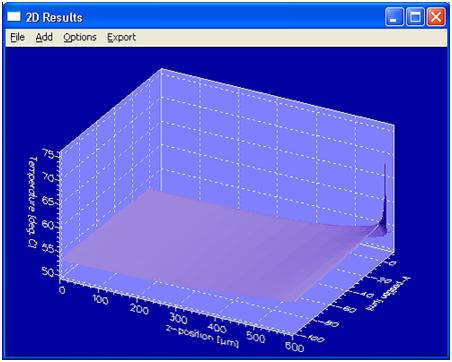
The non-uniformity of the photon density leads to a small temperature variation along the length of device (z-axis) as shown in the figure below. This figure also shows the certical temperature profiles, with the temperature being coolest on the top of the device – next to the heatsink – and hottest at the bottom of the substrate layer.
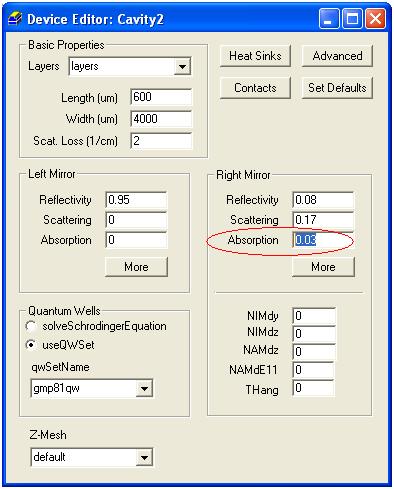
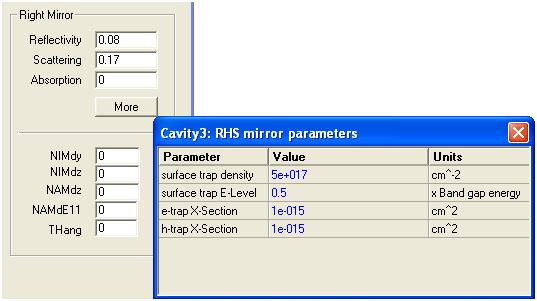
2D simulation – facet heatingHarold can be used study the mechanisms that lead to mirror heating and the Catastrophic Optical Damage that can occur in high-power lasers. Harold will account for mirror heating arising from 1) the absorption of light at the mirrors and 2) the non-radiative recombination at surfaces traps on the mirror. The laser device simulated using several different absorption values for the low-reflectivity mirror.
A 2D temperature profile for device when using non-zero mirror absorption is shown below. A large temperature increase in the vicinity of mirror can be seen; this is localised in the vertical direction according the vertical profile of the optical mode (as the heating is proportional to the incident optical intensity).
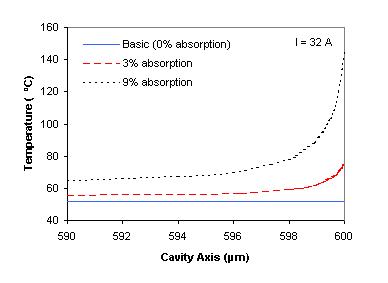
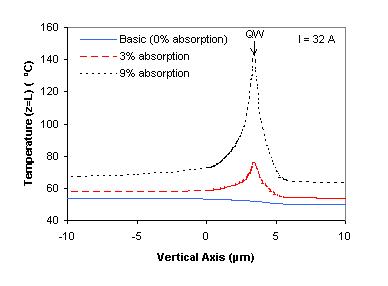
The figures beneath show longitudinal temperature profiles for various values of mirror absorption and the corresponding vertical temperature profiles as measured at the low-reflectivity mirror end of the device.
Harold can model non-radiative recombination at mirror surfaces according to a 2D Shockley-Reed-Hall model.
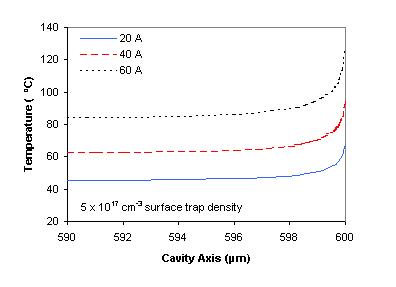
The device was simulated using a constant surface trap density at several different bias currents. The results are shown in the figure below.
|
 © 2023 Photon Design copyright all rights reserved |

 |