|
|
Your source of photonics CAD tools | |
|
| ||
PICWaveA photonic IC, laser diode and SOA simulator |
    |
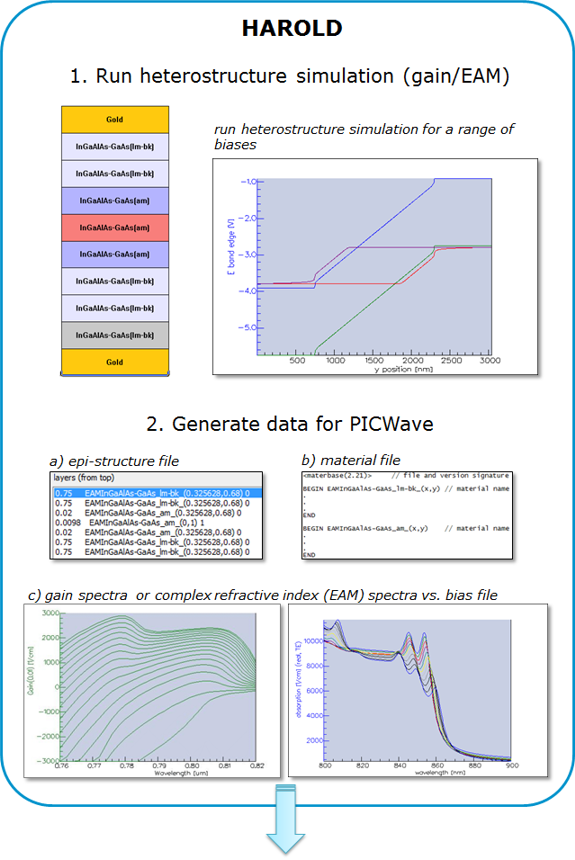
Import hetero-structure models from HaroldHarold can model the detailed physics of (multi) quantum well structures such as laser diodes or electro-absorption modulators (EAM), but is restricted to simple device structures based on a single uniform cavity. In contrast PICWave can model complex devices including DFB and tuneable lasers, laser + modulator devices, and all manner of integrated circuits. However it does not have the ability to compute gain/refractive index spectra from a detailed description of the quantum well structure – rather it starts with a set of “material functions” describing e.g. the gain versus carrier density dependence (for lasers/SOAs), or refractive index versus reverse bias voltage (for EAMs). Harold allows you to do a detailed material simulation (laser or EAM) and import the results into PICWave. This gives you the best of both worlds – a detailed quantum mechanical model of the electronic structure, and a flexible device model. It also has the benefit of allowing the device model to run at high speed since the material functions generated by Harold can be evaluated very quickly.
Importing gain models from HaroldPICWave allows you to import detailed material gain models from Harold or other sources. The following information can be generated by Harold and imported into PICWave:
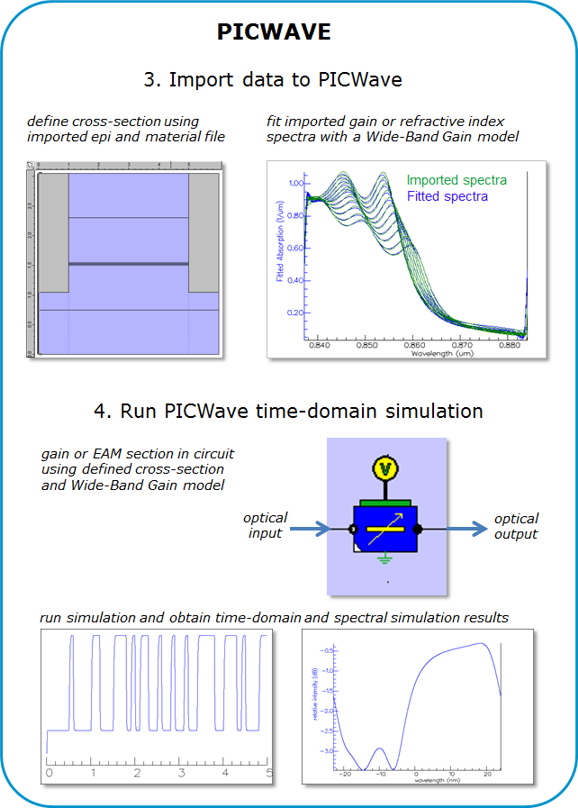
Once they have been exported into PICWave, the gain curves for the hetero-structure need to be fitted in order to be used by the time domain model. This is done in PICWave using a Wide-Band Gain Fitting, which allows you to maintain the accuracy of the fitted curves over a very wide range of wavelength. You can see here in comparison the fitted gain curves obtained with a parabolic fitting, for which the fitting is only valid near the gain peak.
For laser modelling, most of the light is emitted near the peak, and the parabolic gain fitting would be acceptable. For an SOA however an accurate fit over a wide range of wavelength is crucial as the response of the device will be broadband. You can find an example of gain curves import from Harold for the modelling of an SOA here. Importing EAM models from HaroldPICWave allows you to import detailed complex refractive index (absorption/phase index) models from Harold QCSE or other sources. The following information can be generated by Harold QCSE and imported into PICWave:
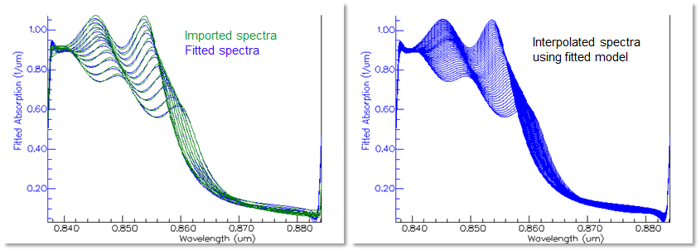
Once they have been imported into PICWave, the refractive index curves for the hetero-structure need to be fitted in order to be used by the time domain model. This is done in PICWave using a Wide-Band EA Fitting, which is able to capture with good accuracy the (typically) higher-order wavelength response and its variation with voltage. An example fitting is shown below for a set of spectra at discrete voltages, along with interpolated spectra generated by the fitted model.
Comparison between PICWave and HaroldPlease see here for a comparison of the active component (laser diode, SOA, modulators etc.) modelling capabilities of PICWave, Harold, Harold XY and Harold QCSE.
|
 © 2023 Photon Design copyright all rights reserved |

 |