|
|
Your source of photonics CAD tools | |
|
| ||
HaroldA hetero-structure laser diode model |
    |
Harold QCSEElectro-Absorption Modulator (EAM) with Quantum-Confined Stark Effect modelThe Harold QCSE module will allow you to model Electro-Absorption Modulators (EAM) and Electro-Refractive Modulators, calculating the absorption spectrum and refractive index spectrum of your device for any range of reverse bias values. Plotting the evolution of absorption and refractive index spectra as a function of bias will allow you to fully characterise how light gets modulated when it travels through the electro-absorption modulator. The model includes a full physical description of the Quantum-Confined Stark Effect (QCSE). You can find a validation with experimental results here for a AlGaAs electro-absorption modulator and a SiGe electro-absorption modulator. In terms of interface Harold QCSE is fully integrated with Harold and the epitaxial structure and QWs are defined using Harold’s layers editor. The EAM modelUnlike other electro-absorption modulator models, Harold QCSE is a rigorous first-principle physical model which relies on a rigorous modelling of the physics at a fundamental level. The EAM model consists of four solvers that are run in sequence:
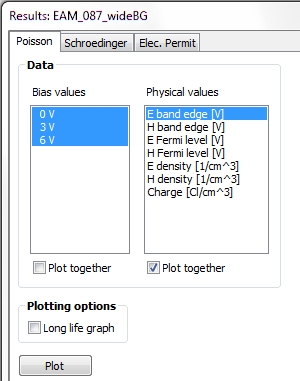
Harold QCSE allows you to follow and control each step of the complex solution.
In a multi-stage model like this, it is sometimes difficult to track the
origin of problems. In Harold QCSE, the user can inspect the results of
the intermediate solvers, obtain physical insight into specific trends
of the device’s behaviour and spot problems at early stages.
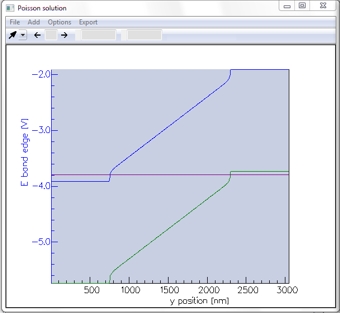
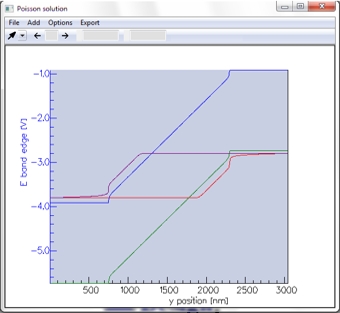
Simulations ResultsPoisson-Drift-Diffusion Solver For a defined range of reverse biases, Harold QCSE can produce the following physical values as functions of vertical position
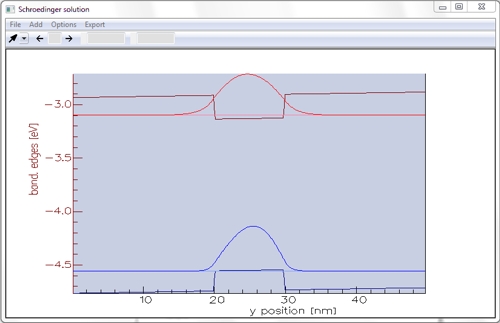
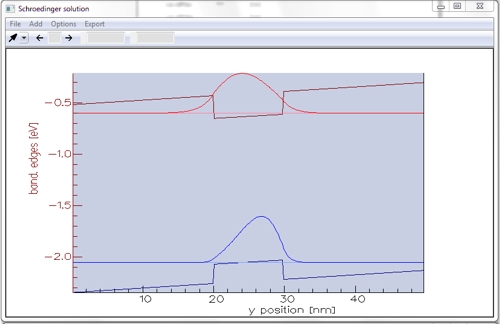
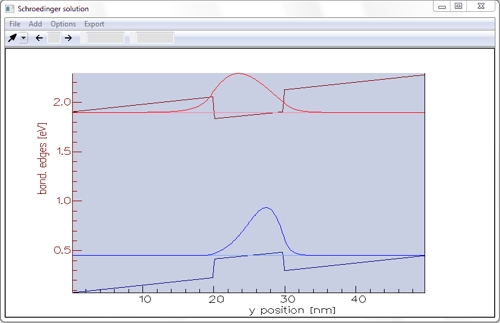
Schrödinger Solver The Schrödinger Solver of Harold QCSE can produce
This tool allows the user to observe the Quantum-Confined Stark Effect (QCSE) in a specific QW structure as a function of reverse bias.
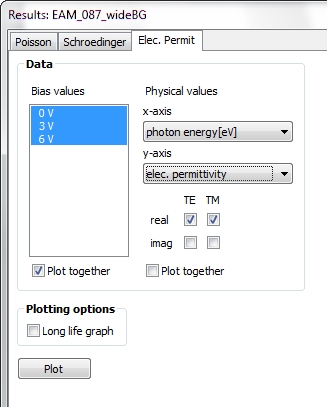
Absorption and refractive index spectra The final results, the absorption and index spectra, are produced for TE and TM polarizations and can be plotted in different units:
The user can chose the temperature, the bias and spectrum range. Validation: comparison with experimental data for AlGaAs and SiGe modulatorsWe used Harold QCSE to model a AlGaAs electro-absorption modulator and a SiGe electro-absorption modulator. The results are shown below alongside published experimental data; as you can see the simulations are in good agreement with the experiments, with all main features reproduced. We expect that the differences in absolute absorption coefficients are due to scaling ambiguities in the experimental papers.
References[1] S.-L. Chuang, S. Schmitt-Rink, D. A. B. Miller and D. S. Chemla, “Exciton Green’s function approach to optical absorption in a quantum well with an applied electric field”, Phys. Rev. B, 43, 2, pp. 1500-1509 (1991) [2] Y.-H. Kuo, Y. K. Lee, Y. Ge, S. Ren, J. E. Roth, T. I. Kamins, D. A. B. Miller, and J. S. Harris, “Quantum-confined stark effect in Ge–SiGe quantum wells on Si for optical modulators”, IEEE J. Sel. Topics Quantum Electron., 12, pp. 1503–1513 (2006)
|
|||||||||||||||||

 © 2023 Photon Design copyright all rights reserved |

 |